Try not to overuse Debug.Log and start using breakpoints!
Debug.Log (or print) can be a great tool for outputting messages to the console when things happen. But what if you want to check the state of a bunch of variables at a certain point in your application?
One way of doing that would be to write a huge Debug.Log message like this:
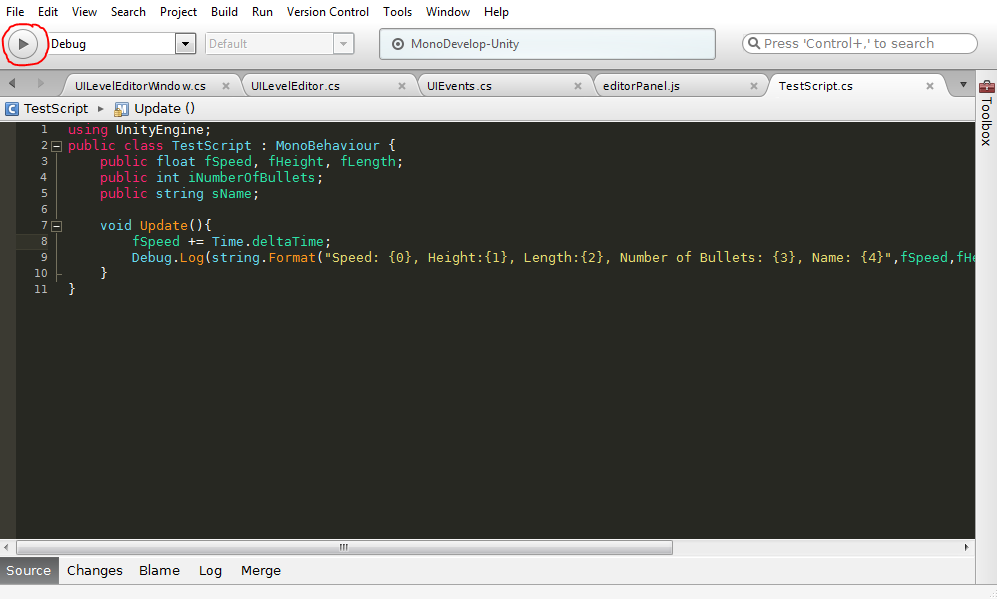
using UnityEngine;
public class TestScript : MonoBehaviour {
	public float fSpeed, fHeight, fLength;
	public int iNumberOfBullets;
	public string sName;

	void Update(){
		fSpeed += Time.deltaTime;
		Debug.Log(string.Format("Speed: {0}, Height:{1}, Length:{2}, Number of Bullets: {3}, Name: {4}",fSpeed,fHeight,fLength,iNumberOfBullets,sName));
	}
}
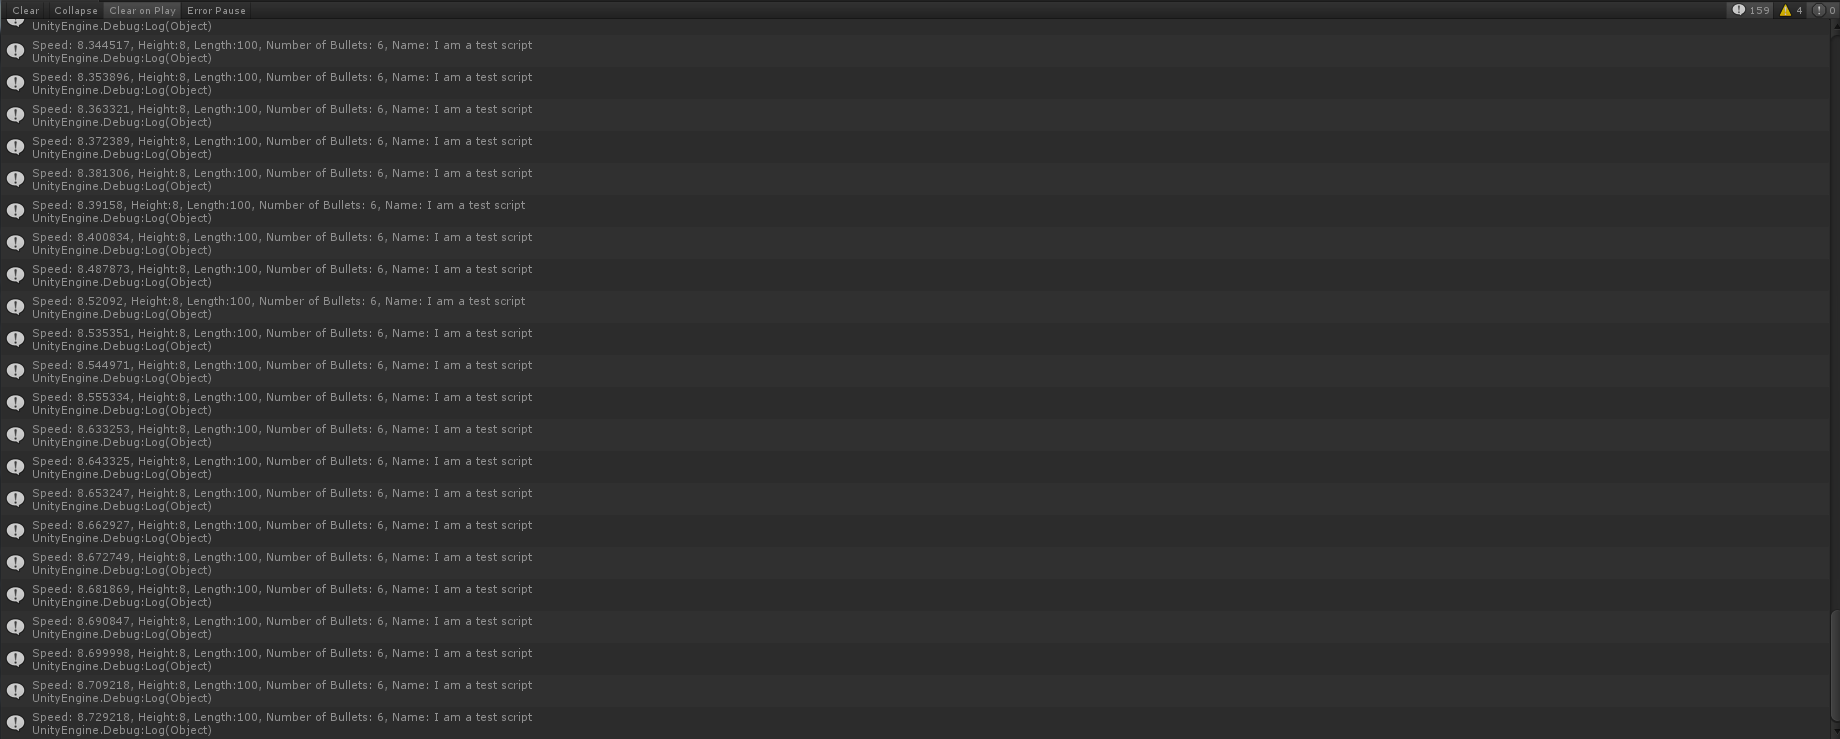
Which will result in your console window looking something like this..
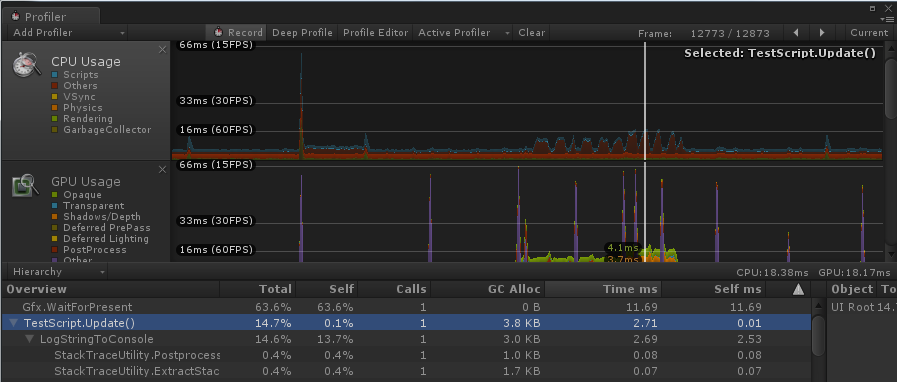
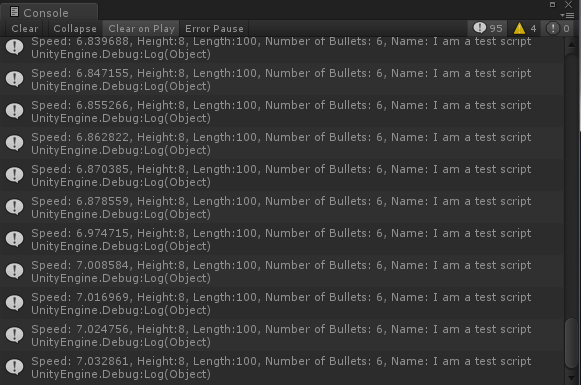 Not to mention the spikes your frame-rate will suffer because it will write to disk each frame…
This example is very basic, but I’m sure if you have been programming with Unity for long enough you will have used Debug.Log to output something at some point. I’d recommend using it for most situations, however there are some instances when a Debug.Log just wouldn’t cut it.
Enter… MonoDevelop Debugger
There are some out there who would cry out in pain just simple muttering of those words pre-Unity 4, in previous versions it used to crash Unity, crash MonoDevelop and in some isolated instances blow everything up. However, I’ve been using it for the past year to debug everything I’ve worked on and have found it incredibly useful (okay, it did crash a couple of times, but it saved me far more time than it took to reload everything).
If that hasn’t scared you off of using MonoDevelop’s Debugger, carry on reading!
So… How can I use it?
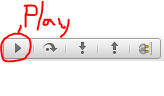
To start using the Debugger, all you have to do is press the “Play” button in the top left of MonoDevelop’s window:
 If you press that, MonoDevelop will prompt you to “Attach to a Process”. Just select your instance of unity and press attach. The dialogue will vanish and you will be left with a “Stop” button instead of a play button.
To start debugging, press your mouse to the far left edge of the editor (next to the line number) and a red dot will appear, you would have just created a breakpoint!
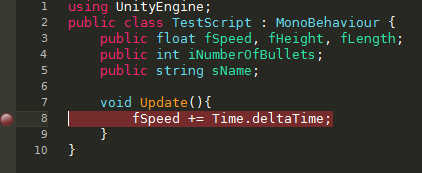 This will not do anything for now, however, if you now go to Unity and press play in your editor window something great will happen…
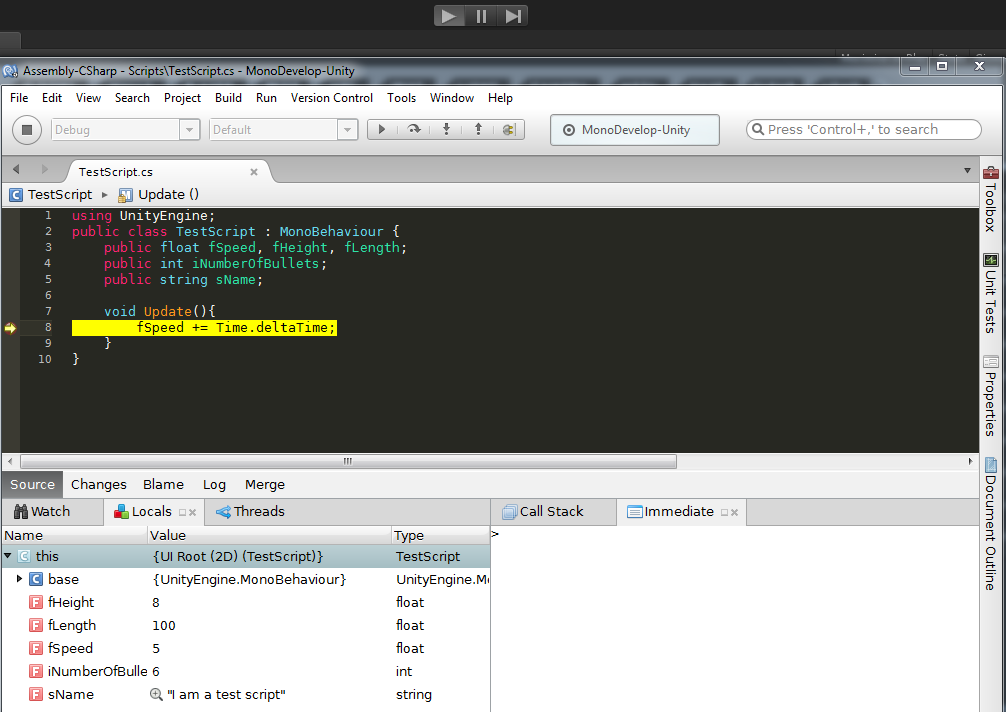
At the very bottom of the window, if you have the locals window open (if not, Go to View > Debug Windows > Locals), you will see all of the variables that currently exist in the local instance and their values at the time of the breakpoint being hit.
To continue the applications execution, just press the “Play” button in MonoDevelop
 Your script will continue its execution (and Unity’s editor will no longer be frozen). Of course in this instance, the script will hit the breakpoint again on the next frame. So just left click the breakpoint in MonoDevelop and hit the Play button again so it doesn’t execute the breakpoint again.
It gets better!
With breakpoints, you can make them stop the application running when certain conditions are met. For example, imagine you want to check what the values are when the fSpeed variable reaches 10. To do that, press the Stop button in MonoDevelop, and Right click on your breakpoint, then press Breakpoint Properties.
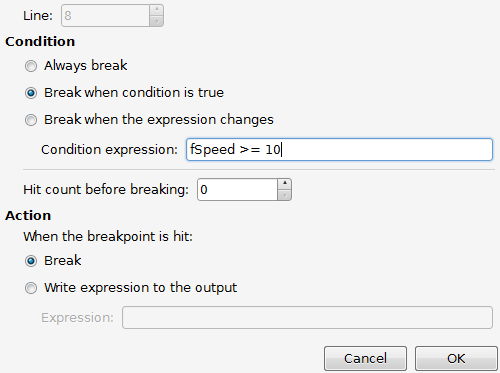
Set the condition to “Break when condition is true” and set the “Condition Expression” to “fSpeed >= 10” and then press OK.
Re-attach the editor to Unity and press the Play button in Unity, when the condition is met the breakpoint will fire and stop the application.
A note about using Condition Breakpoints: They cause performance issues as it has to validate the expression each time it is run.
@dgoodayle Note -> Conditional breakpoints can slow down the program as it has to do checks when the code execution hits the conditional
— Steven Yau (@yaustar) September 11, 2014
That’s the basics
In these examples, it may not seem very useful to be using the debugger, however imagine if you are writing your own AI code or perhaps trying to track down a strange memory leak bug. In many instances I have relied on these tools to find and fix them! Try experimenting, let and if it helps you in any way try and help others! If you find anything particularly useful that breakpoints can do please let me know (tweet me! @DGoodayle), I’m always looking to expand my toolset! Also, Tracepoints are very useful! Richard Fine has made a quick screencast explaining them:
@DGoodayle Here we go: http://t.co/70h4SoRuuY
— Richard Fine (@Superpig) September 11, 2014
Hope it helps you!

Recent Comments